Day 2 — Advanced Excel & Transitioning to Power BI
Theme: Finishing Excel, then making the leap — data modelling, integration, and transformation
Prerequisite: Day 1 — Excel Foundations, or equivalent comfort with formulas, functions and PivotTables.
The shape of the day
The morning finishes Excel — the advanced formula and data techniques a professional analyst actually uses. The afternoon introduces Power BI, and you’ll find it far less alien than expected: Power Query and the Data Model you meet in the morning are the Power BI engine, shipped inside Excel.
By lunchtime you’ll have built an automated dashboard in Excel. By the end of the day you’ll have built the same kind of thing in Power BI, and understood why the second one scales and the first one doesn’t.
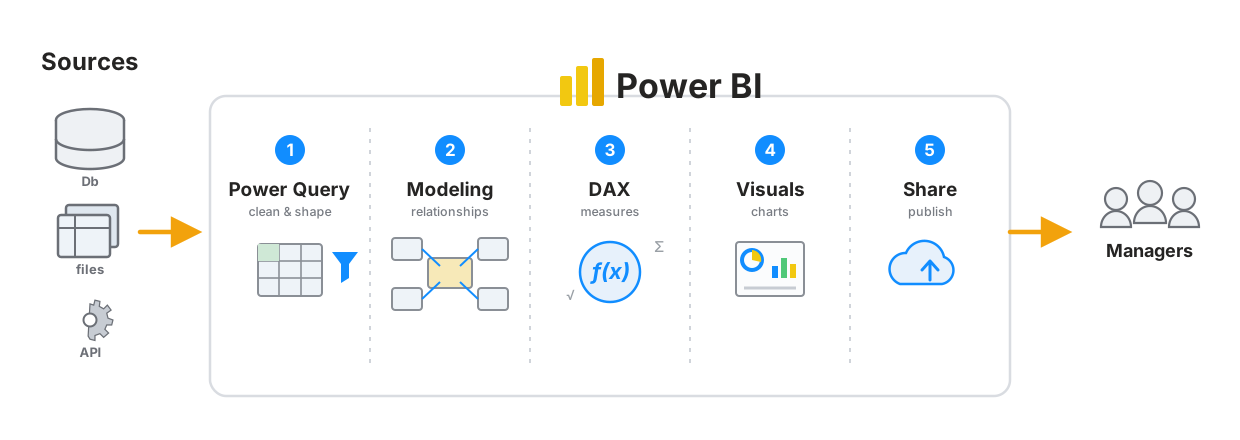
Power BI at a glance — you build one stage per module across Days 2 and 3.
Morning Session — finalising Excel
| # | Module | Time | You will learn | Files |
|---|---|---|---|---|
| 1 | Advanced Formulas | 75 min | XLOOKUP, INDEX/MATCH, IFS, named ranges, Tables, dynamic arrays (UNIQUE, SORT, FILTER) |
Start · Answers |
| 2 | Power Query & Power Pivot in Excel | 90 min | Get & Transform, append vs merge, unpivot, folder combine, the Data Model, first DAX measures, financial dashboard case study | Case study workbook |
Module 2 source files — download source_files.zip (all 7 CSVs), unzip into one folder, and import them in the exercises.
Afternoon Session — introducing Power BI
| # | Module | Time | You will learn | Files |
|---|---|---|---|---|
| 3 | The Power BI Ecosystem & Your First Dashboard | 60 min | Desktop/Service/Mobile, connecting data, visuals, slicers, cross-filtering | orders.csv · customers.csv |
| 4 | Connecting to Different Data Sources | 40 min | Excel, CSV, folders, SQL, JSON, delimited text; Import vs DirectQuery | masterdata.xlsx · prices.json · events_log.txt · SQL script |
| 5 | Data Cleaning & Transformation in Power BI | 50 min | The same Power Query, plus column profiling; a full cleaning gauntlet; unpivot | orders_jan · orders_feb · sales_flattable · sales_monthly |
| 6 | Data Modelling & Introduction to DAX | 90 min | Star schemas, relationships, date tables, role-playing dimensions, measures vs columns, filter context, time intelligence, KPIs | the dim_*/fact_* CSVs — data_modeling_data.zip |
Module 4’s twelve monthly files (
MonthlySales/Sales_Jan.csv…Sales_Dec.csv) are used for the “combine files from a folder” exercise. Grab them together as MonthlySales.zip and unzip into one folder.
Finished Power BI files: My First Dashboard.pbix · Data Cleaning (Power Query).pbix · Data Modeling.pbix
Module 6 is the most important module of the day. Visuals are easy; a correct model is what makes them true.
Homework
Clean, Model, Measure — about 45 minutes. Two messy quarterly exports from four African stores: clean them, append them, merge in lookups, model them, and write five measures. Exact checkpoint figures are given so you can verify every stage yourself.
Files: sales_q1.csv · sales_q2.csv · stores.csv · products.csv
Expected outcome
You can connect to data wherever it lives, clean it repeatably, model it correctly, and calculate on it with DAX — ready for visualisation on Day 3.
A note if you’re on a Mac
Power BI Desktop is Windows-only. Options: a Windows VM (Parallels/UTM), Boot Camp, a cloud PC, or the Power BI Service’s browser editing (reduced, but workable).
If none is available, the morning session runs perfectly on Mac Excel, and you can still read the afternoon lessons and inspect the provided .pbix files on a colleague’s machine. The concepts — Power Query, the Data Model, DAX — are identical in both products, so nothing is wasted.
What carries forward
| From Day 1 | Becomes on Day 2 |
|---|---|
SUMIF / COUNTIF |
CALCULATE with filter arguments |
| Absolute vs relative references | Filter context in DAX |
| PivotTable four zones | Power BI visual field wells |
| Excel slicers | Power BI slicers — same name, same behaviour |
| One flat table | A star schema of facts and dimensions |
XLOOKUP between tables |
A relationship, drawn once |
Previous: Day 1 — Excel Foundations · Next: Day 3 — Visualizing, Publishing & Automating · Course home: README
© 2026 Global Academy. Prepared for the ZIMASCO (Kwekwe) workshop. Facilitated by Tapiwa Zireva. Licensed to participants for personal learning — not for redistribution, resale, or reuse in other training without permission.